- Home
- The Feature
- Phoenix Named One of the Noisiest In The Nation
Phoenix Named One of the Noisiest In The Nation
Information and Stats Provided by 42Floors.com
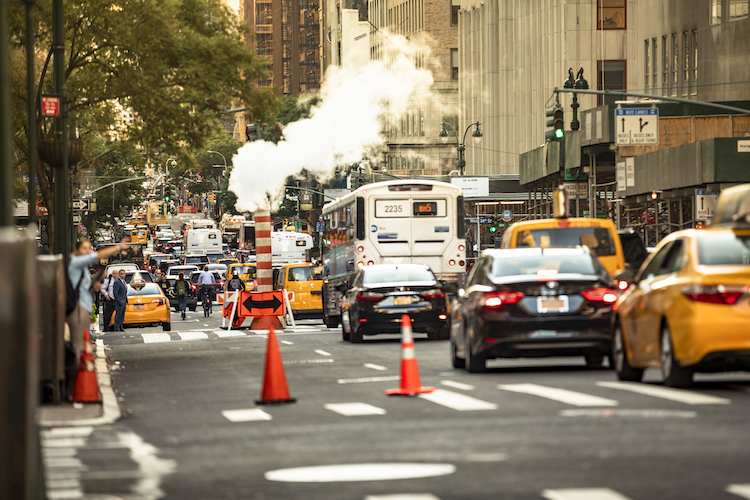
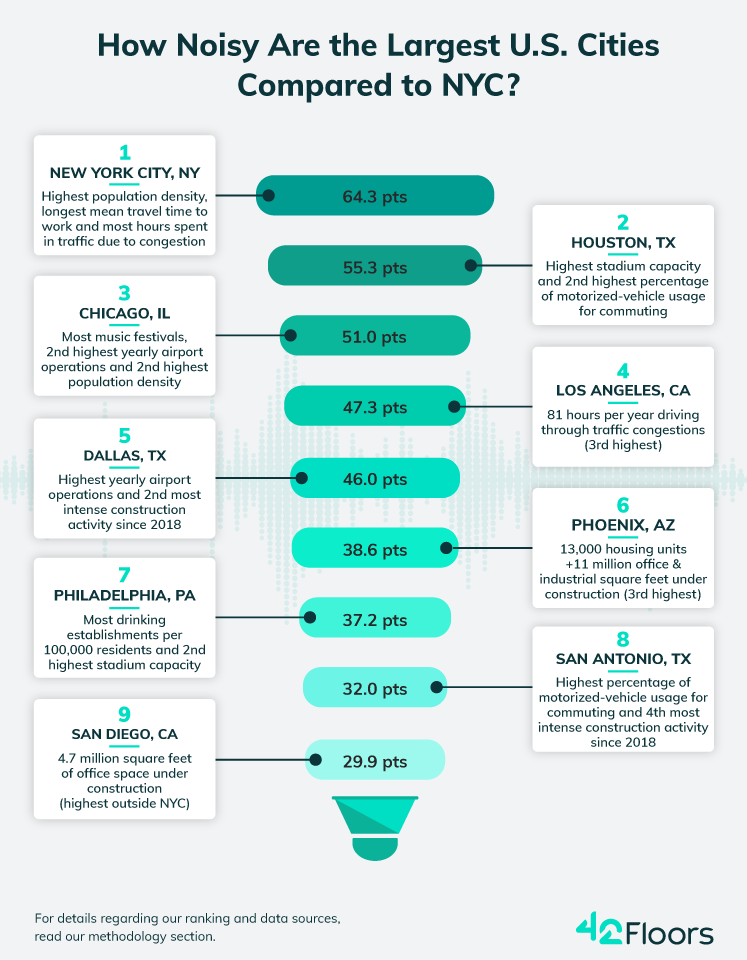
When you think of noisy cities, which heavily populated cities come to mind? New York City is of course the biggest offended when it comes to noise, but there are plenty of other cities across the country that are struggling with increasing levels of noise pollution.
While scientists and advocates have been aware of this concern since the early 1900s, finding comprehensive solutions to reduce noise pollution requires a multifaceted approach.
First, any measures to address this issue would need to identify the worst offenders in the context of each city. To this end, 42Floors proposes a two-part study that seeks to rank the noisiest large and mid-sized U.S. cities. Specifically, they ranked entries based on their performances across 12 metrics, including: the number of annual operations at airports servicing a city; the amount of construction activity in the last five years, as well as the current development pipeline; population density; and the percentage of residents using motorized vehicles for their daily commute.
Secondly, while some noises might be unpleasant or unwanted, cities need things like construction, transportation and an active social scene to thrive and ultimately meet the needs of their residents.
One Arizona city made the list as a noise offender and as Arizona’s largest urban city, it is no surprise that it is Phoenix.
Phoenix’s soundscape is marked by similar noise sources as that of Dallas, with intense commercial development in the last five years resulting in the third-highest density of industrial square footage per capita. What’s more, residents of the Arizona city will have to contend with the sounds of active construction sites in future years, as well, because Phoenix has nearly 11 million square feet of industrial space in the pipeline.
Home to the third-busiest aviation hubs in our ranking with 948,340 annual landings and take-offs, Phoenix also had the fourth-highest percentage of commuters traveling to work via a motorized vehicle (76%). And, while the streets of Arizona’s capital are by no means quiet (especially during peak congestion hours), Phoenicians might be glad to learn that they spend far less time on their commute to work and fewer hours per year stuck in traffic, on average, than the other cities on the list.
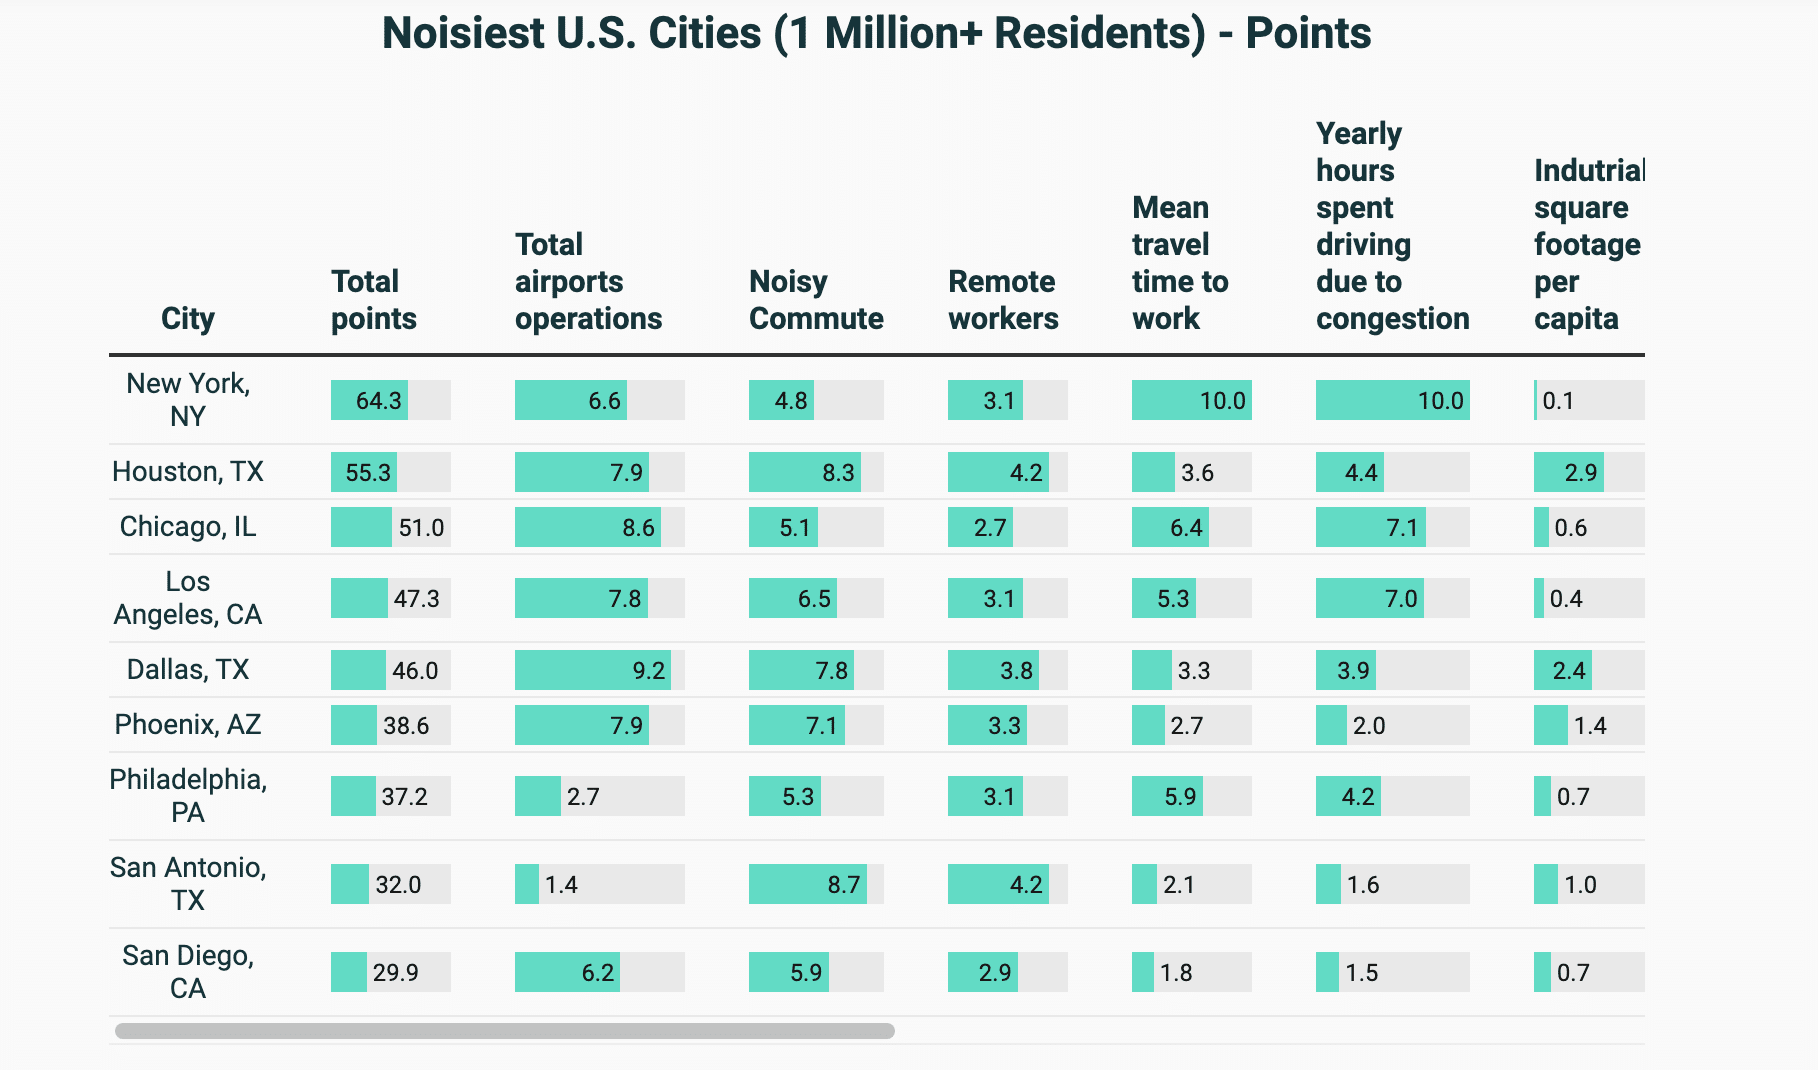
Below is a list of the Large Noisiest cities:
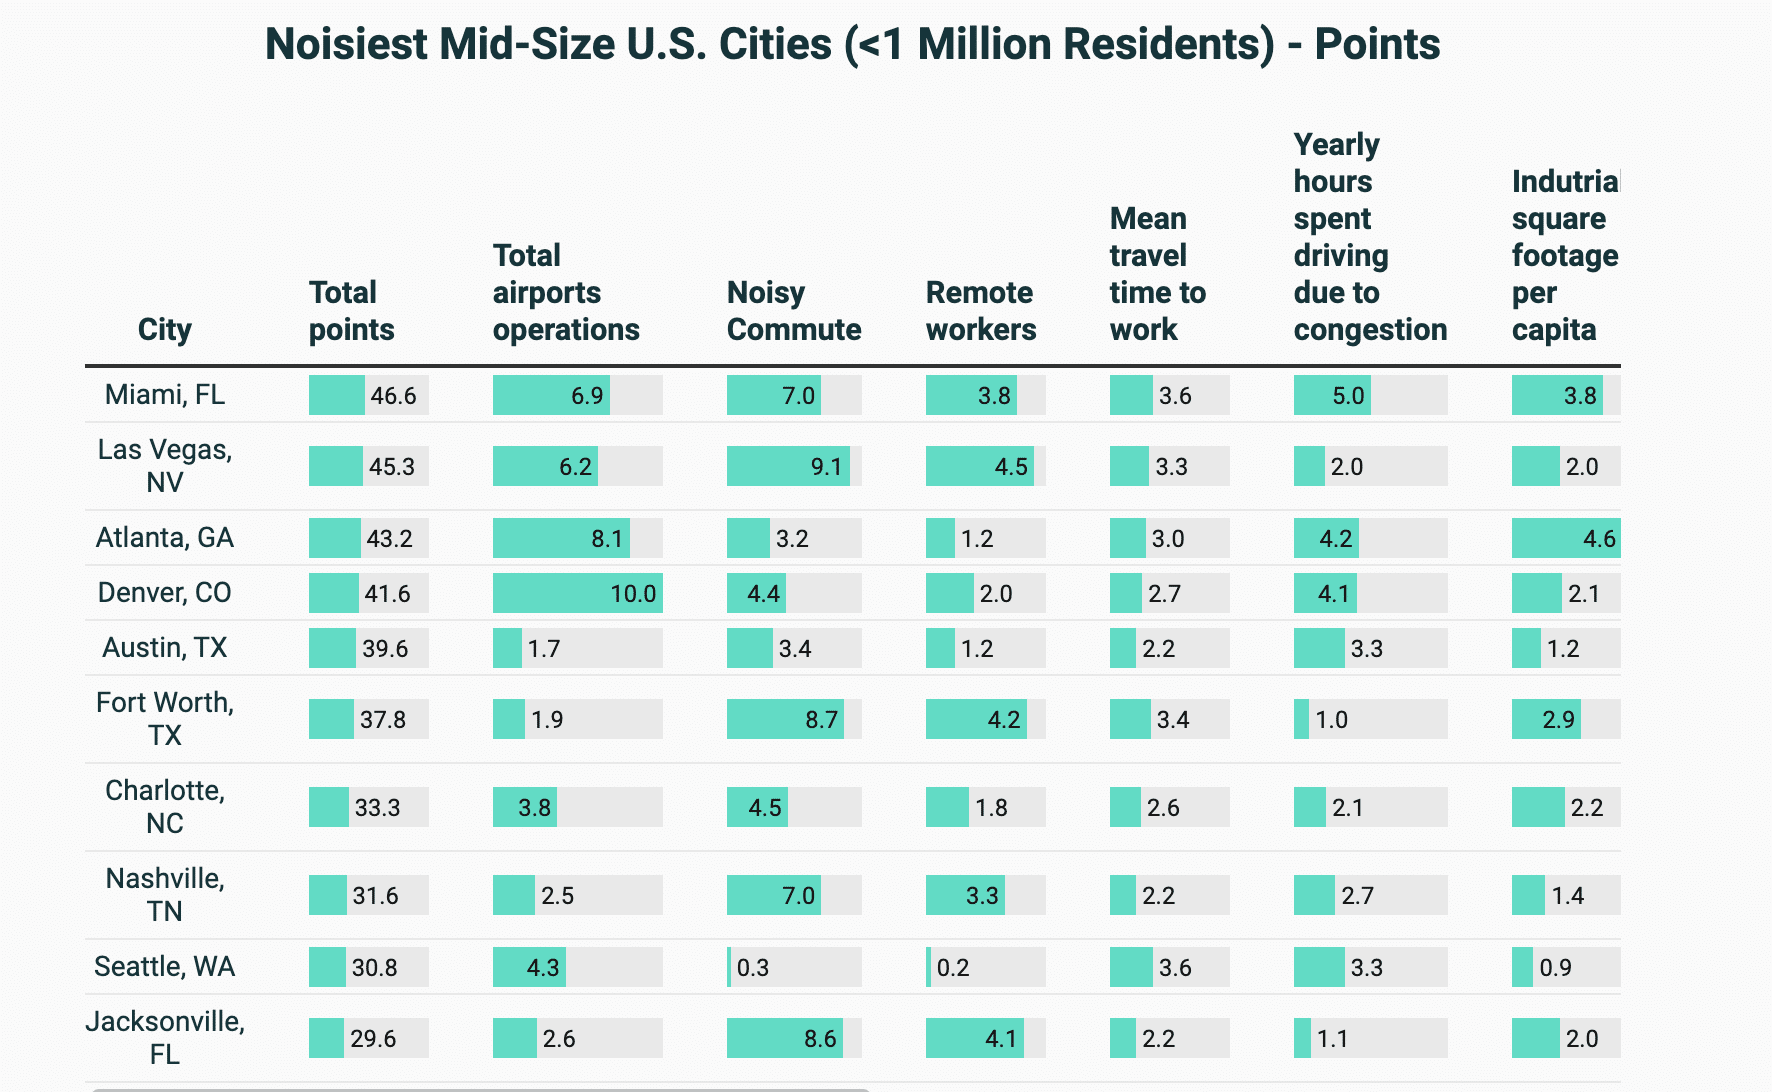
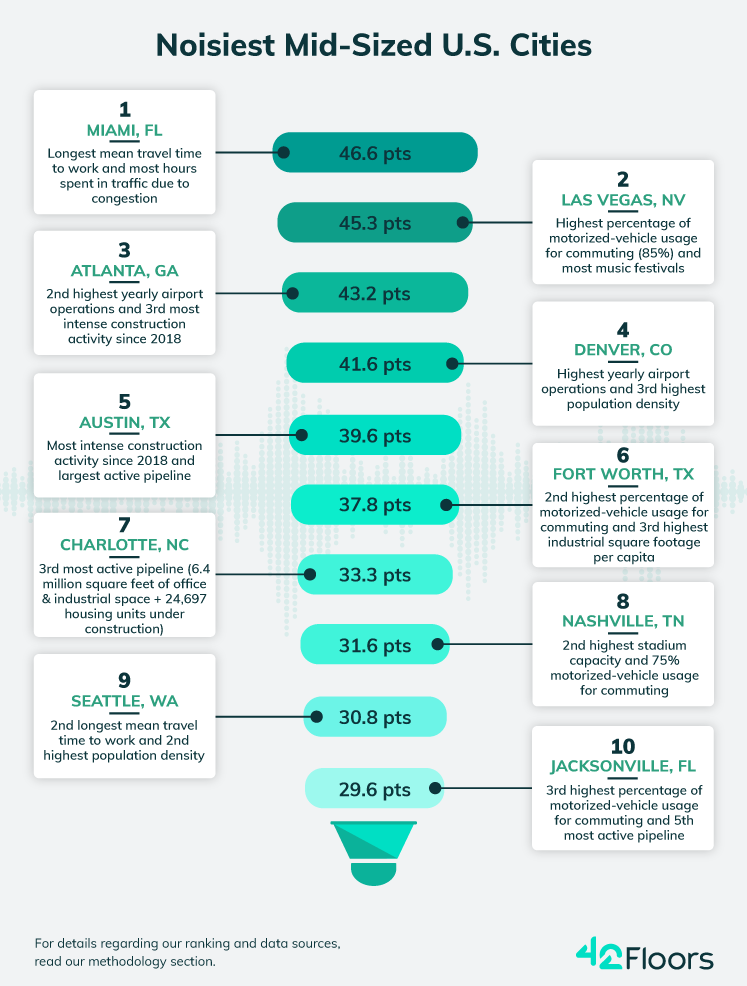
Below is a list of the Mid-Sized Noisiest cities:
Who Decides What Constitutes Noise Pollution?
What constitutes unnecessary or harmful levels of noise, as well as how to mitigate its effects on residents remains a complex and contentious issue. For instance, residents might put up with the inconvenience of living near a construction site if it will eventually alleviate the local housing shortage or deliver conveniently located job opportunities in the future. In the same way, large events held in densely inhabited downtowns can be distracting, but they also tend to be a seasonal occurrence, as opposed to the daily humdrum of road congestion.
Conversely, trying to deal with traffic by adding highway lanes can be a double-edged sword: Research shows that these measures generally lead to induced demand (prompting even more people to use their cars) and do little to nothing to bring down noise levels.
Meanwhile, the increased frequency of airport landings and take-offs happening above residential areas — aided by technologies such as the NextGen air traffic control system — is likely to have a disproportionate effect on residents living outside the city core. Furthermore, these are often the very same people who have already been displaced by gentrification.
In any case, as local communities try to negotiate a pace of development that doesn’t have adverse effects on their quality of life, they have a key role to play in decisions about which sources of sound pollution need to be addressed. In that respect, this study hopes to become one of the multitude of perspectives required to provide comprehensive and equitable solutions to these problems.
Methodology
This analysis is broken down into two separate rankings: the first part gauges the performances of U.S. cities with populations of 1 million residents or more, while the second part looks at urban areas with populations below the 1-million threshold.
The ranking of the noisiest cities across both categories was based on 12 selected indexes, as defined below:
“Total airport operations” represents the number of operations (landings and takeoffs) for airports serving the city. Values scored were based on data gathered by the Federal Aviation Administration’s Operations Network (OPSNET). The maximum weight for this metric was 10 points.
“Noisy commute” is defined by the percentage of workers using motorized vehicles for their commute — car, truck, or van; public transportation; taxicab, motorcycle; or other means. The values scored were based on the U.S. Census Bureau’s 2021 American Community Survey data. The maximum weight for this metric was 10 points.
“Remote workers” represents the percentage of home-based professionals. The values scored were based on U.S. Census Bureau data. This metric is inversely proportional (the higher the percentage, the smaller the score). The maximum weight for this metric was 5 points.
“Mean travel time to work” is defined as average length of a one-way trip to work (measured in minutes). The values scored were based on the U.S. Census Bureau’s 2021 American Community Survey data. The maximum weight for this metric was 10 points.
“Yearly hours spent driving due to congestion” is based on 2022 traffic data from TomTom. The maximum weight for this metric was 10 points.
“Industrial square footage per capita” represents a city’s overall industrial inventory divided by its total population. The values scored were based on U.S. Census Bureau and CommercialEdge data. The maximum weight for this metric was 5 points.“Construction activity” is a compound metric, ranking entries based on the total amount of housing units, as well as industrial and office space added to their respective inventories between 2018-2022. The values scored were based on CommercialEdge data, with points equally apportioned across all three use types. The maximum weight for this metric was 15 points.
“Under construction” is a compound metric that includes each city’s total square footage of office, industrial, as well as number of housing units currently in the pipeline. The values scored were based on 2023 CommercialEdge data, with points equally apportioned across all three use types. The maximum weight for this metric was 15 points.
“Music festivals” represents the total number of music events taking place within a city. The values scored were based on 2022 data gathered by Music Festival Wizard. The maximum weight for this metric was 5 points.
“Drinking establishments per 100,000 residents” represents the density of recreation establishments recorded under NAICS code 722410. This includes bars, taverns, nightclubs, or drinking places primarily engaged in preparing and serving alcoholic beverages for immediate consumption. Values scored were based off 2020 U.S. Census County Business Patterns numbers. The maximum weight for this metric was 5 points.
“Population density” represents the number of people in a square mile. Values scored were based off the U.S. Census Bureau’s 2021 American Community Survey data. The maximum weight for this metric was 5 points.
“Stadiums” represents the overall capacity of stadiums and indoor arenas within each city. Values scored were based off data centralized by Wikipedia. The maximum weight for this metric was 5 points.